**Analysis of Etherscan’s Labeled Smart Contracts
Premise**: This report contains a basic analysis, done a few months ago for internal purposes of Stateless Consensus and published here in case it interests others. We received from Etherscan a dataset consisting of about a million labeled smart contracts. A contract in the dataset, is often labeled with more than one label.
We examine zero/non-zero storage slots count, deployment patterns and contract-level expiry policies.
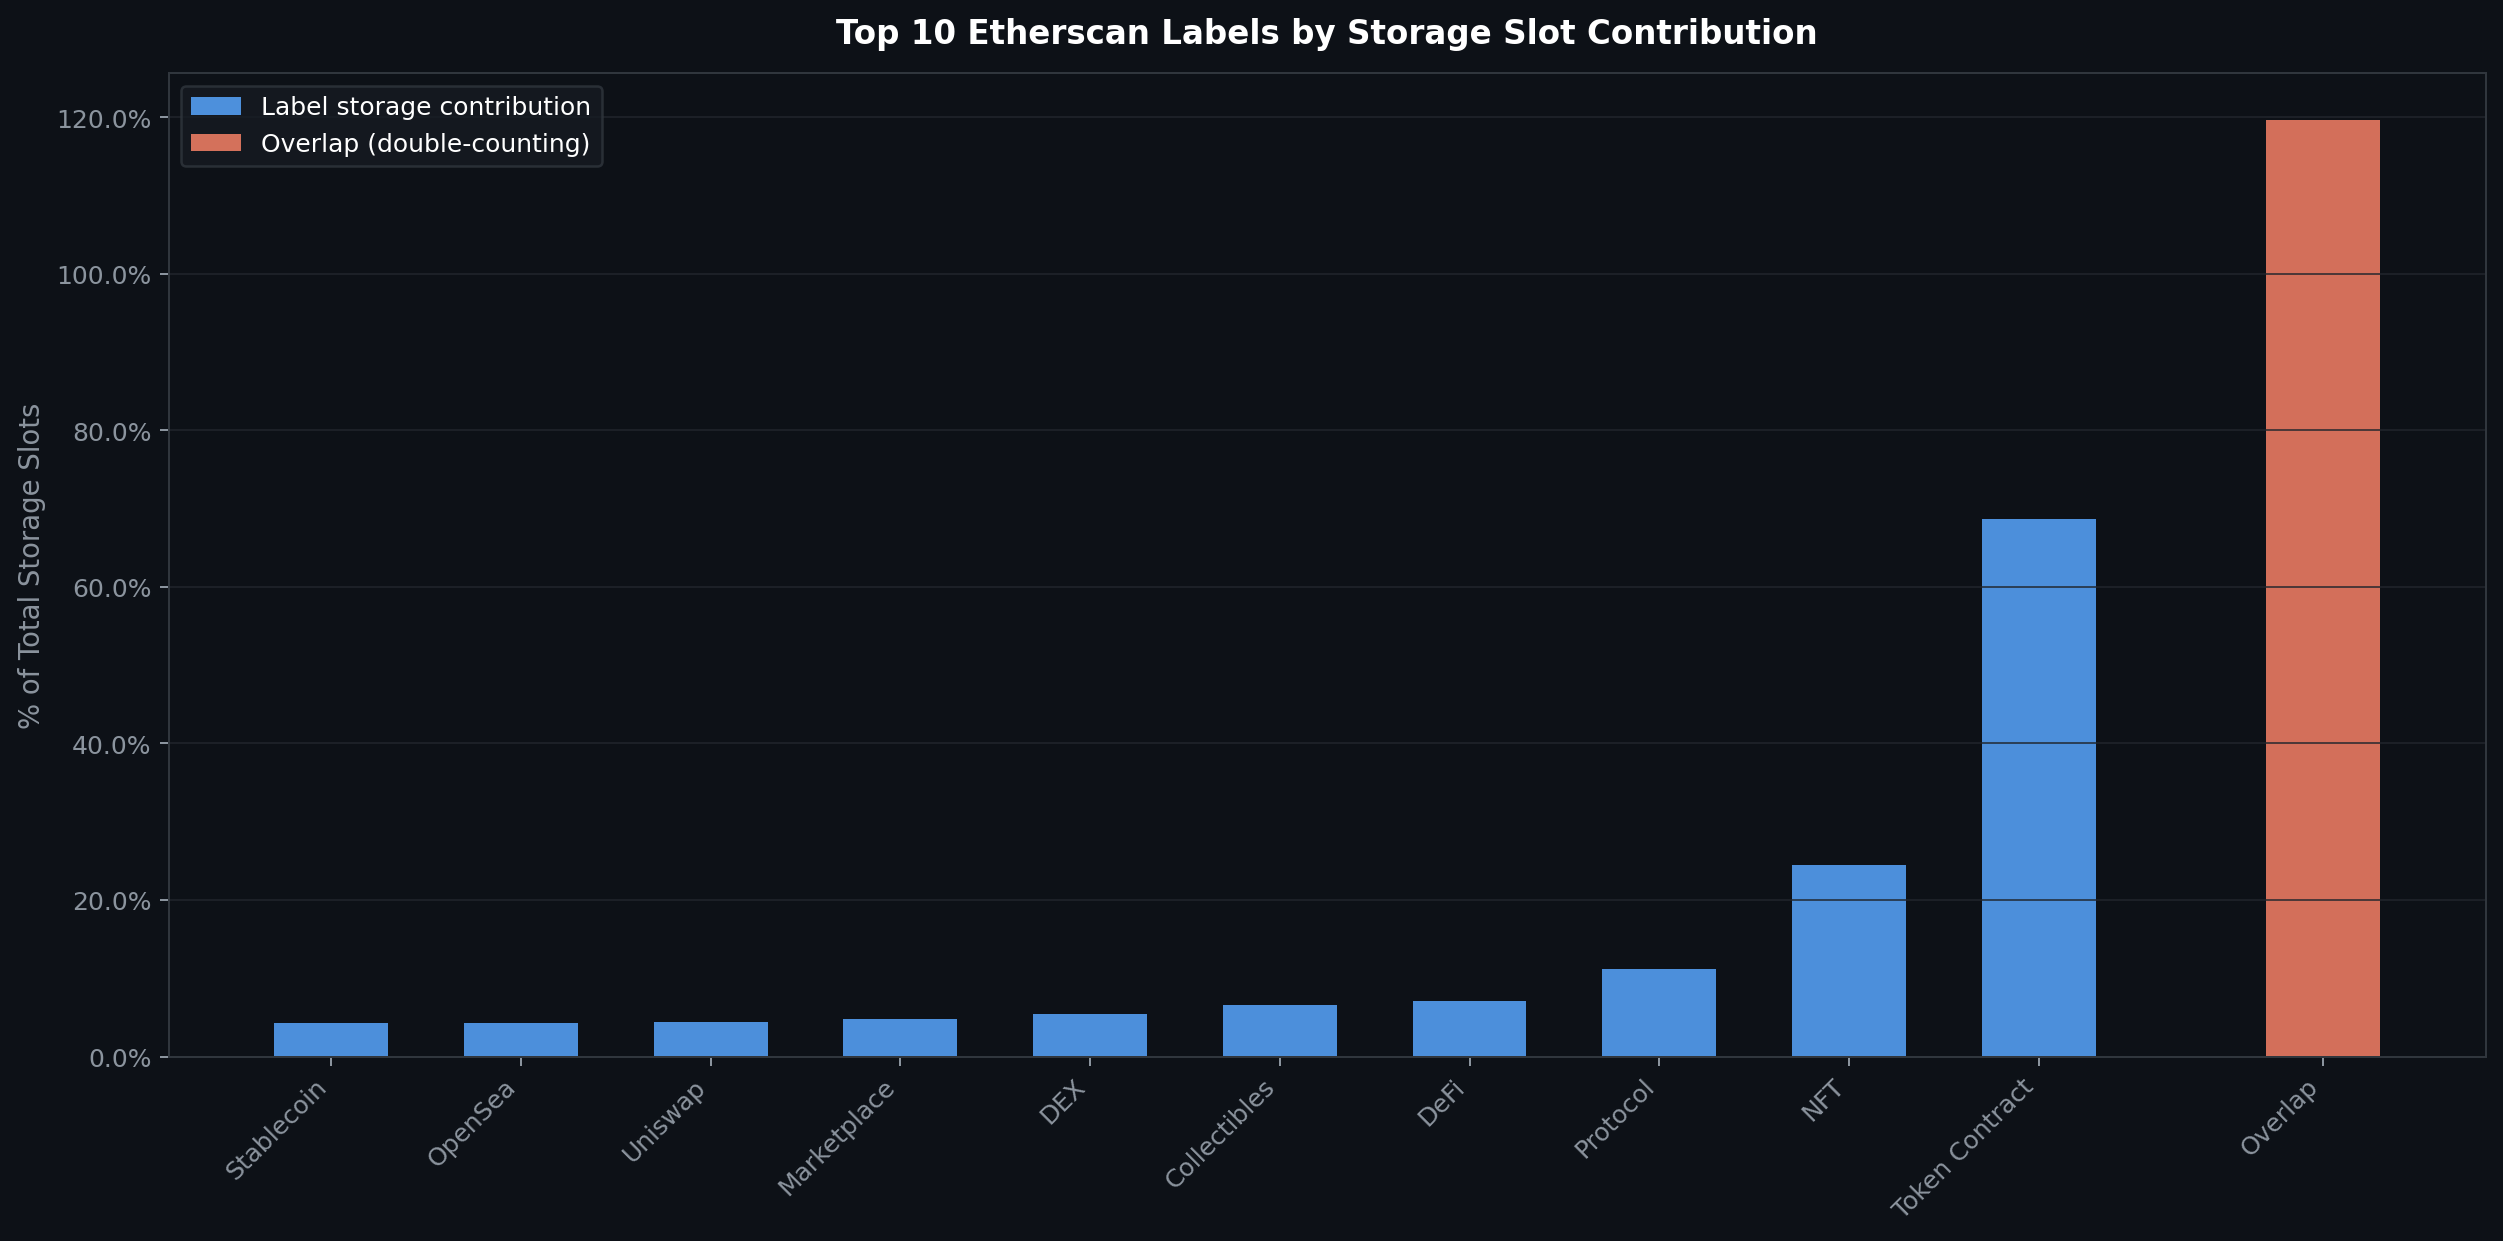
In our first plot, we count the storage slots of contracts appearing in each label and present the top 10 labels. Here one must keep in mind that there is a duplicate counting, for many storage slots, arising from the fact that many contracts admit multiple labels. The 100/% for the calculation of the blue columns is the total storage slots of all contracts in the dataset ie without duplicated counting.
Key Insight: Token contracts and NFTs dominate the Ethereum state among top labels.
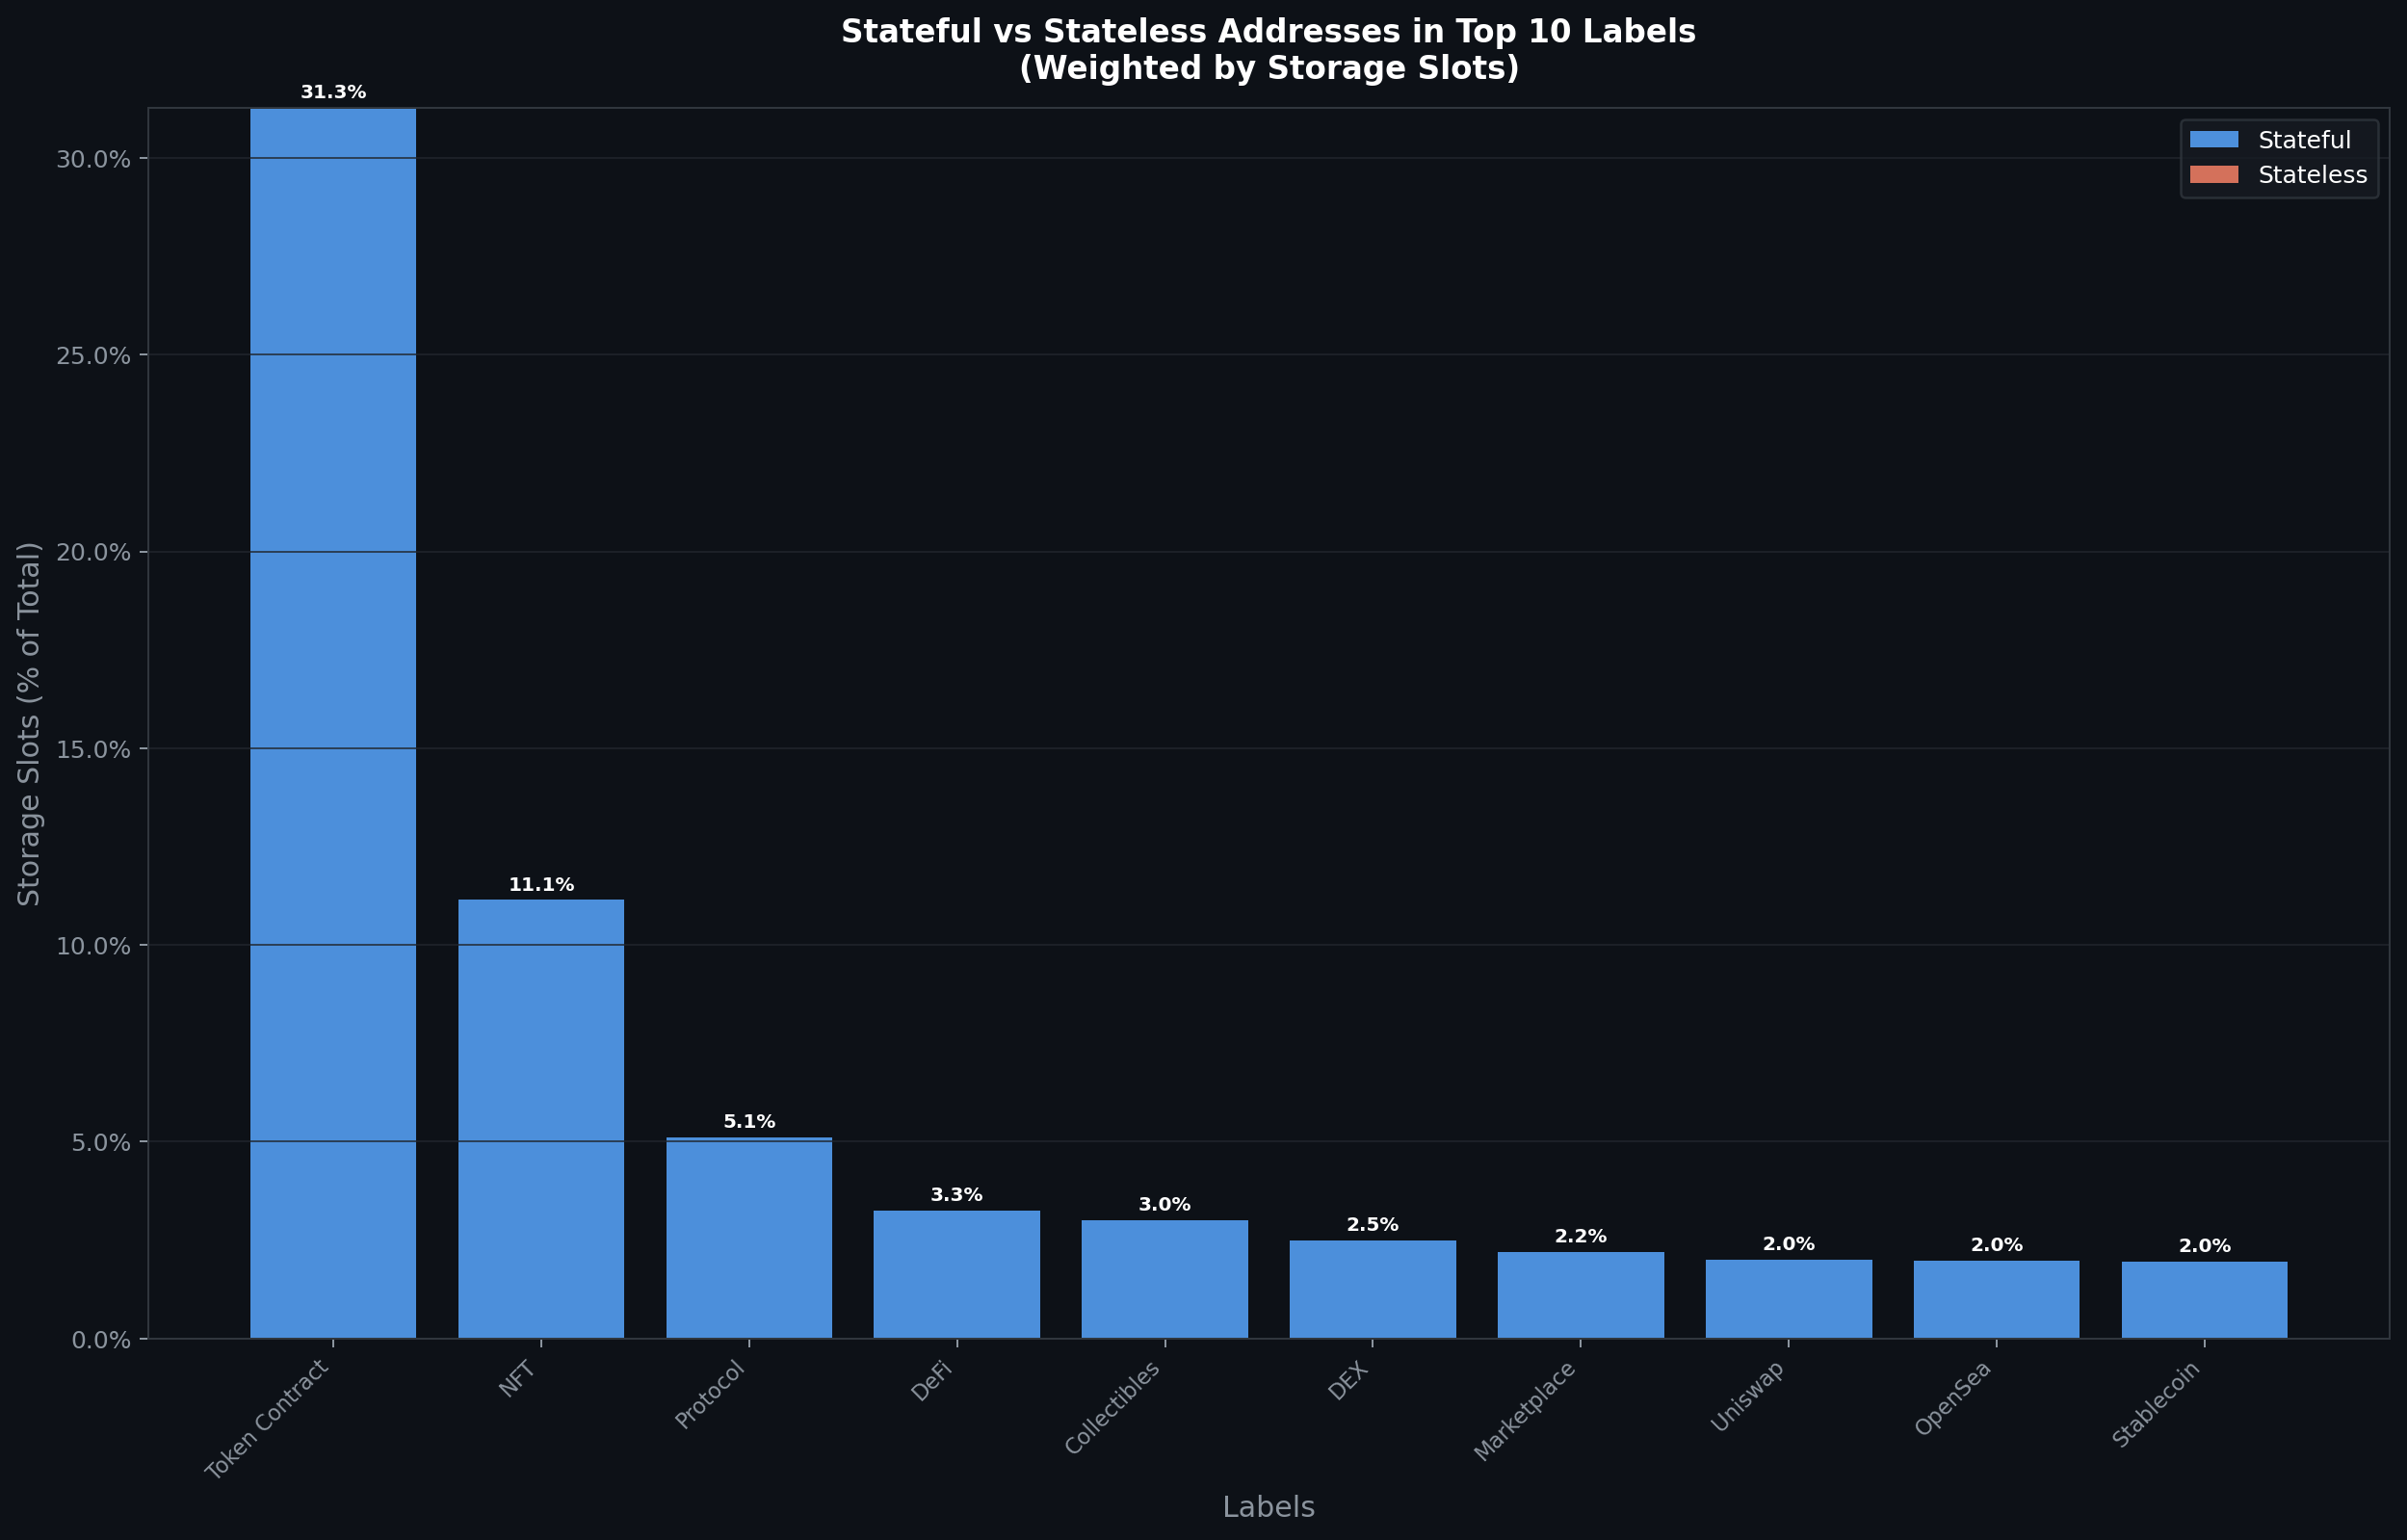
In the second plot, we employ a different counting, where the percentages in the blue columns refer to the 100% being total storage slots *with* duplicate counting, ie a slot belonging to a contract with N labels is counted N times. This plot also shows Statefull vs Stateless (labeled) contract proportion where
Stateful Contract = non zero storage count, Stateless Contract = zero storage count.
Key Insight: Almost all Etherscan labeled contracts (99.9%) are stateful.
Next we consider “contract-level“ expiry policies for our labeled contracts.
In an expiry policy of n-months (for us n=6,12), we expire the entire storage tree of a contract if none of its storage slots were accessed (read/written to) in the past n-months.
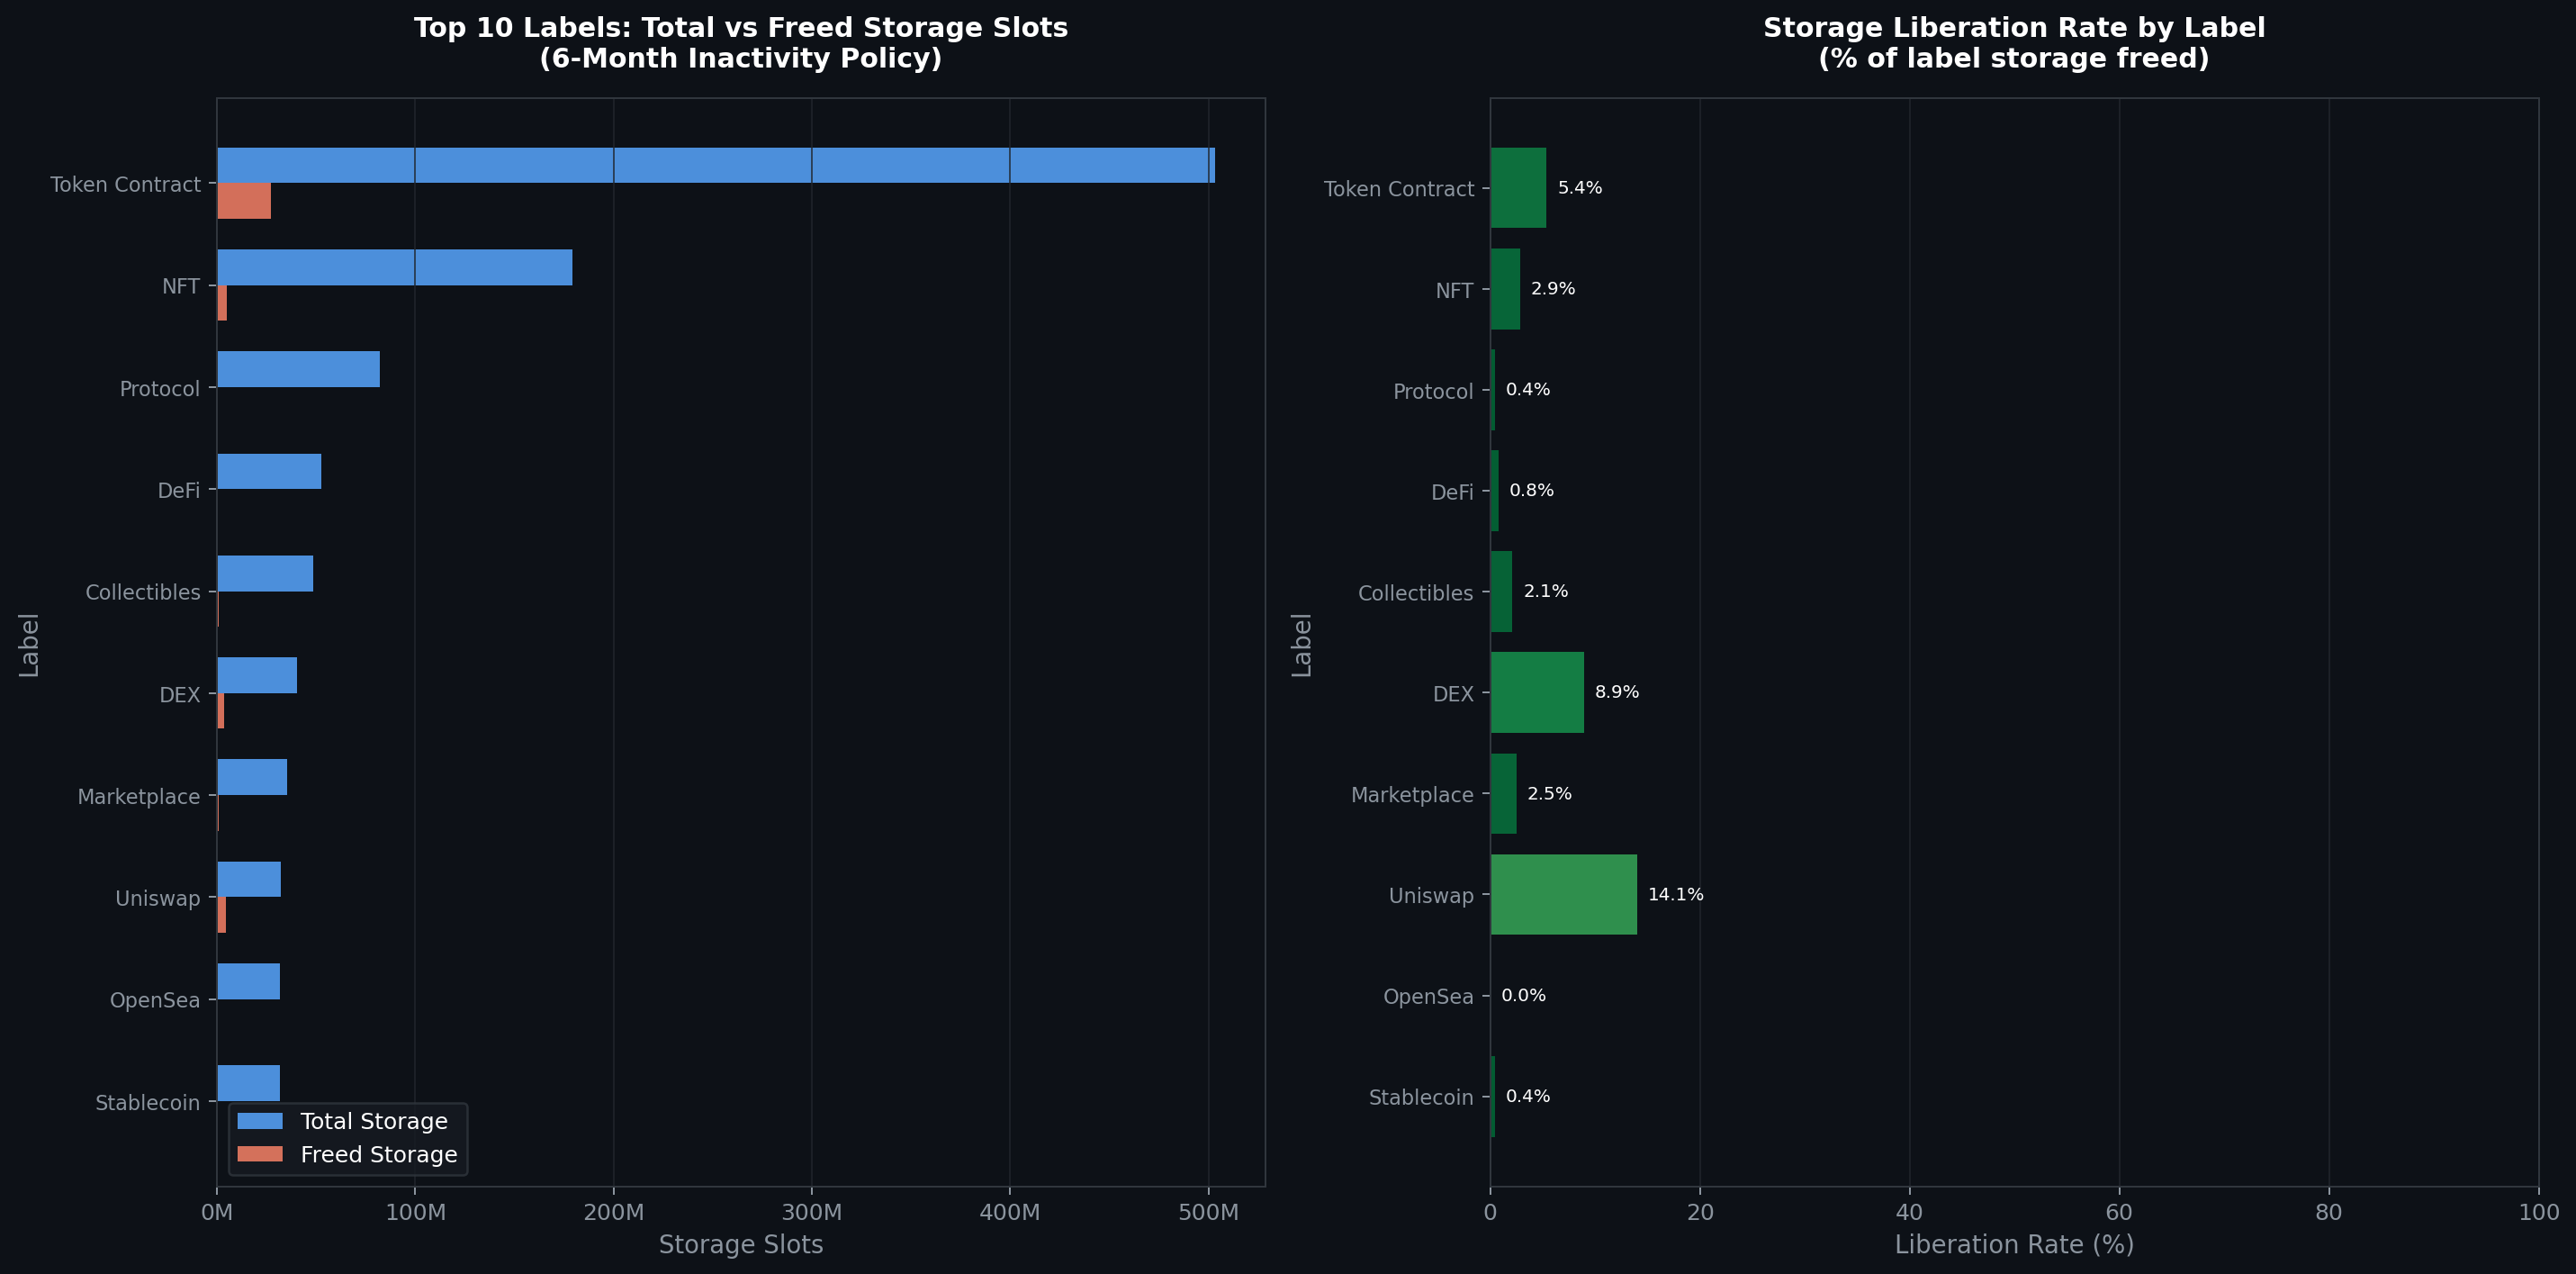
In this plot, we see, for each of the top 10 labels, what will be the percentage of storage slots that would be freed-up by a 6-months (contract-level) expiry policy (in green on the right or in orange on the left). That is, for each column, the orange bar of the left plot represents the percentage of storage slots freed-up out of the blue bar (which in turn represents the total storage slots of contracts in the given label).
Key Insight: 6-months contract expiry policy shows token contracts will free-up the most storage slots.
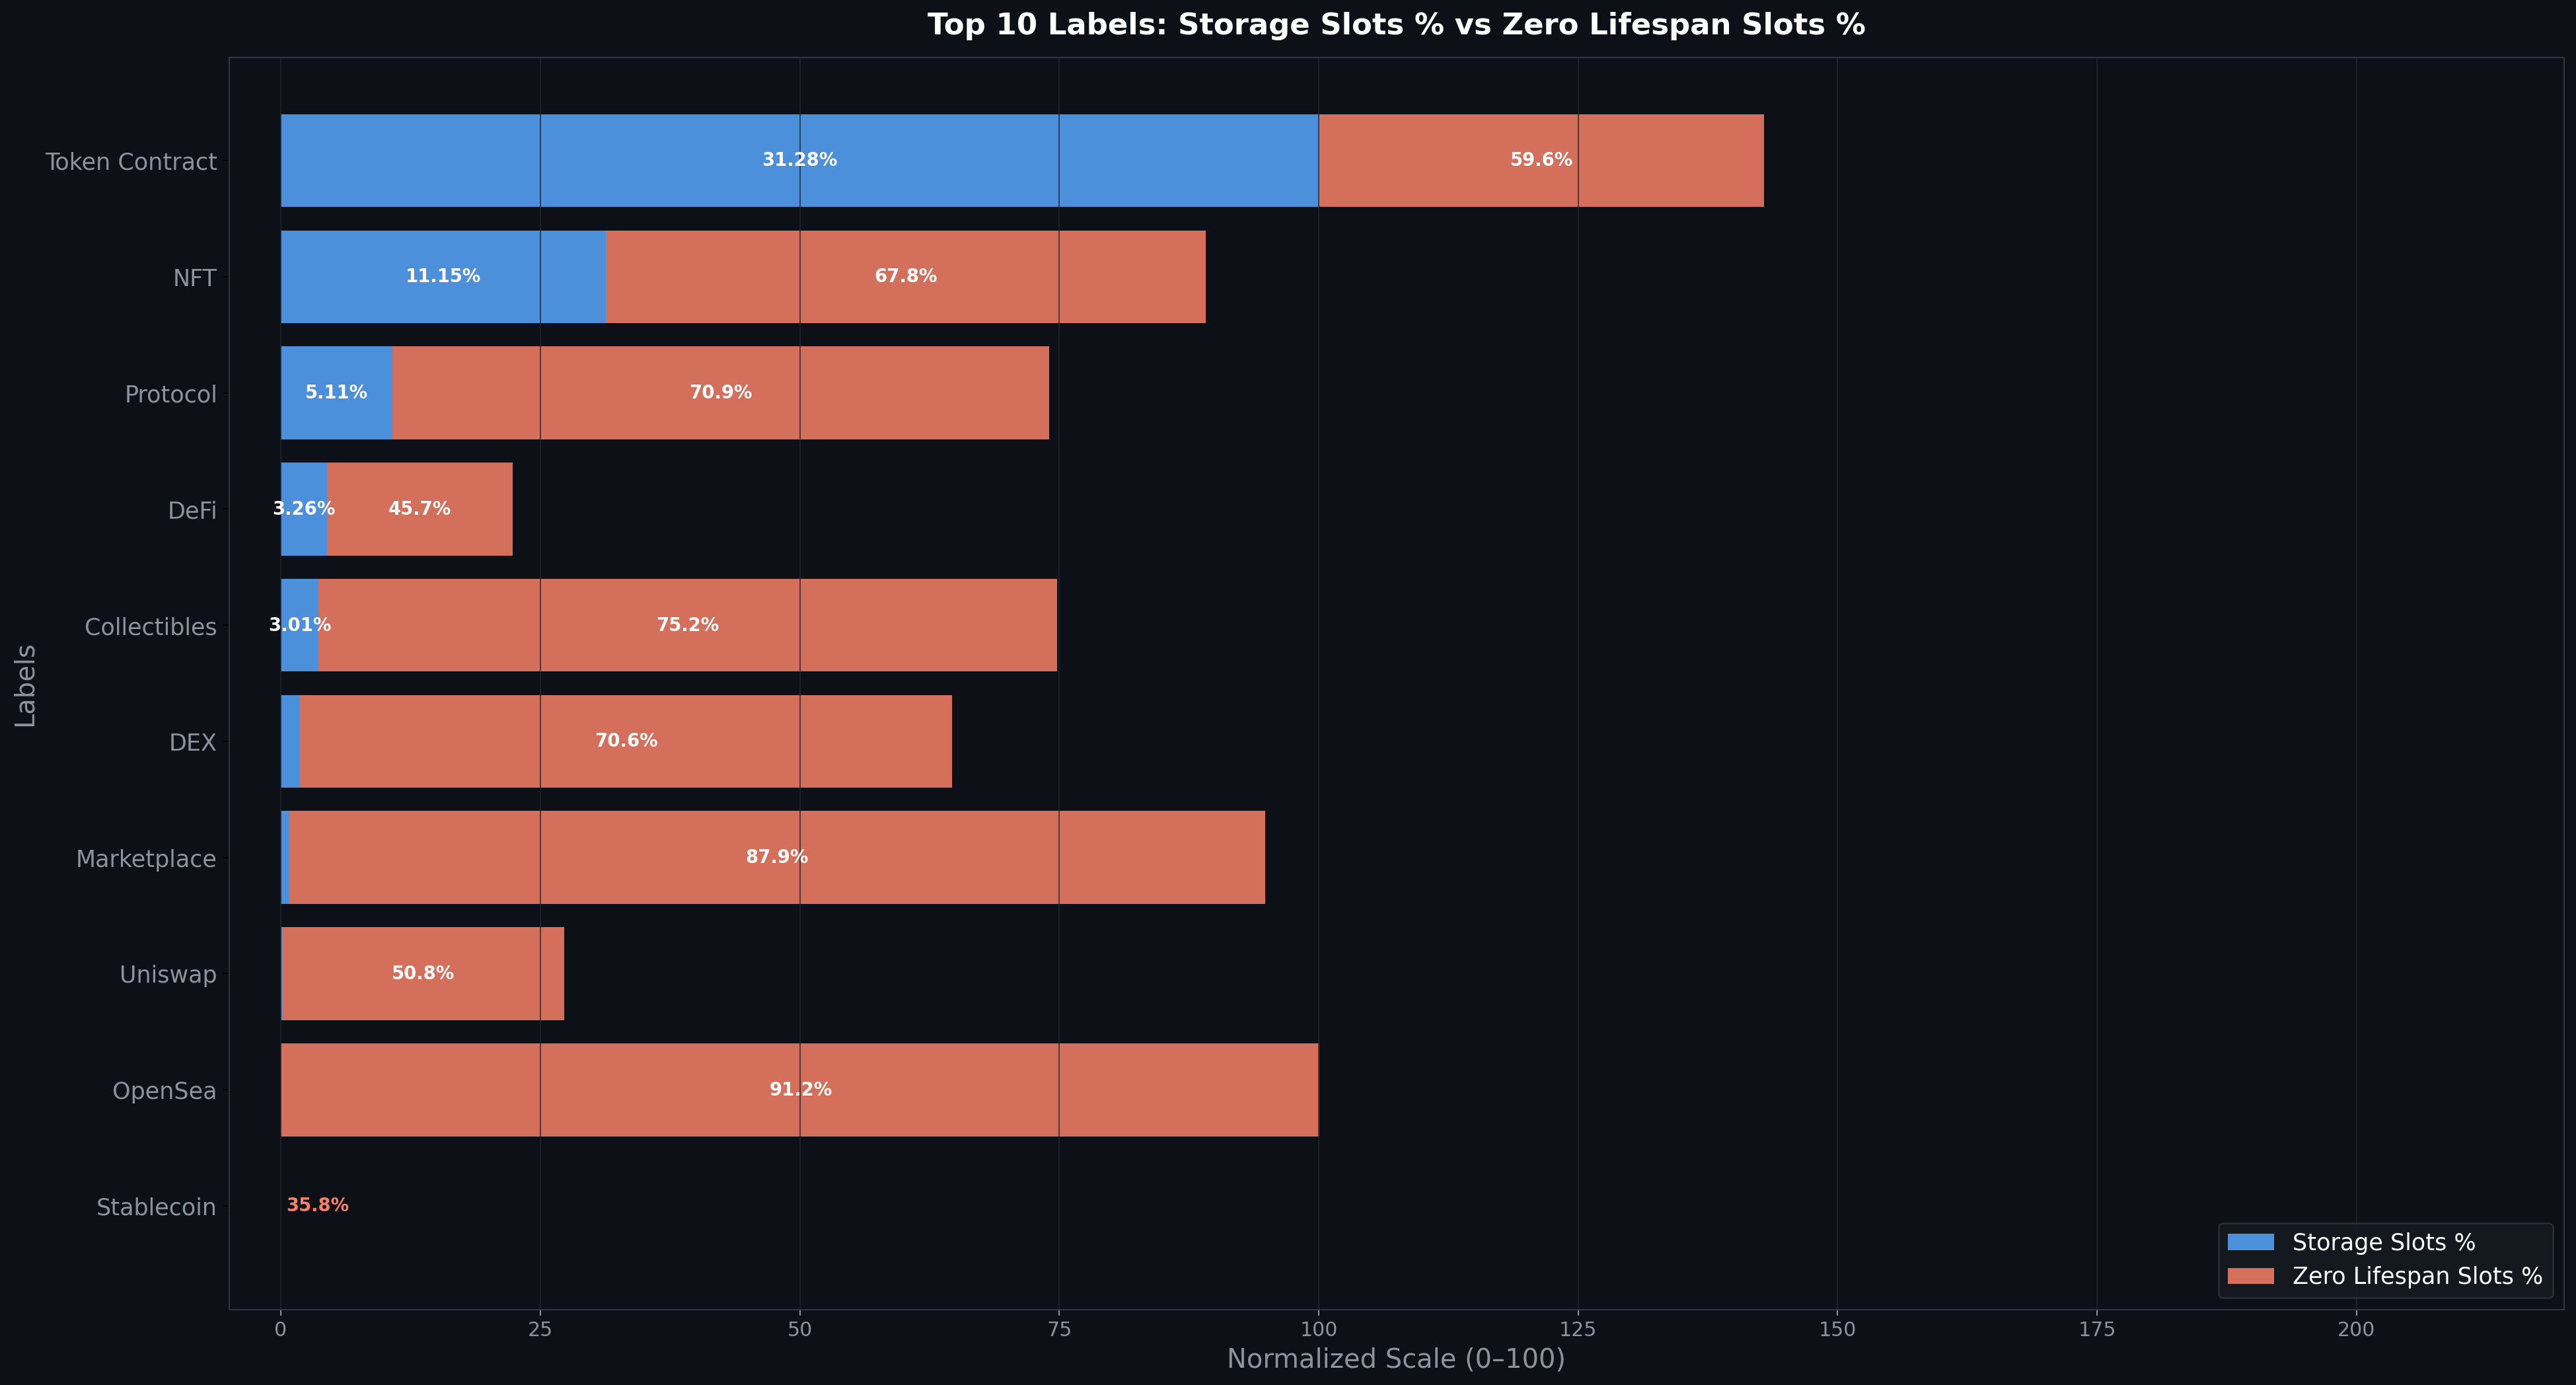
The plot above analyses zero-lifespan slots. A slot has a zero lifespan if it was not accessed after the block it was created. As before, we focus on the top 10 labels (in terms of storage slots).
Note that the orange bar represent the percentage of zero-lifespan slots out of the total storage slots of the given label.
Key Insight: Many zero-lifespan slots exist even within top contract labels. In particular, more than half of the storage slots of token contracts have zero-lifespan.
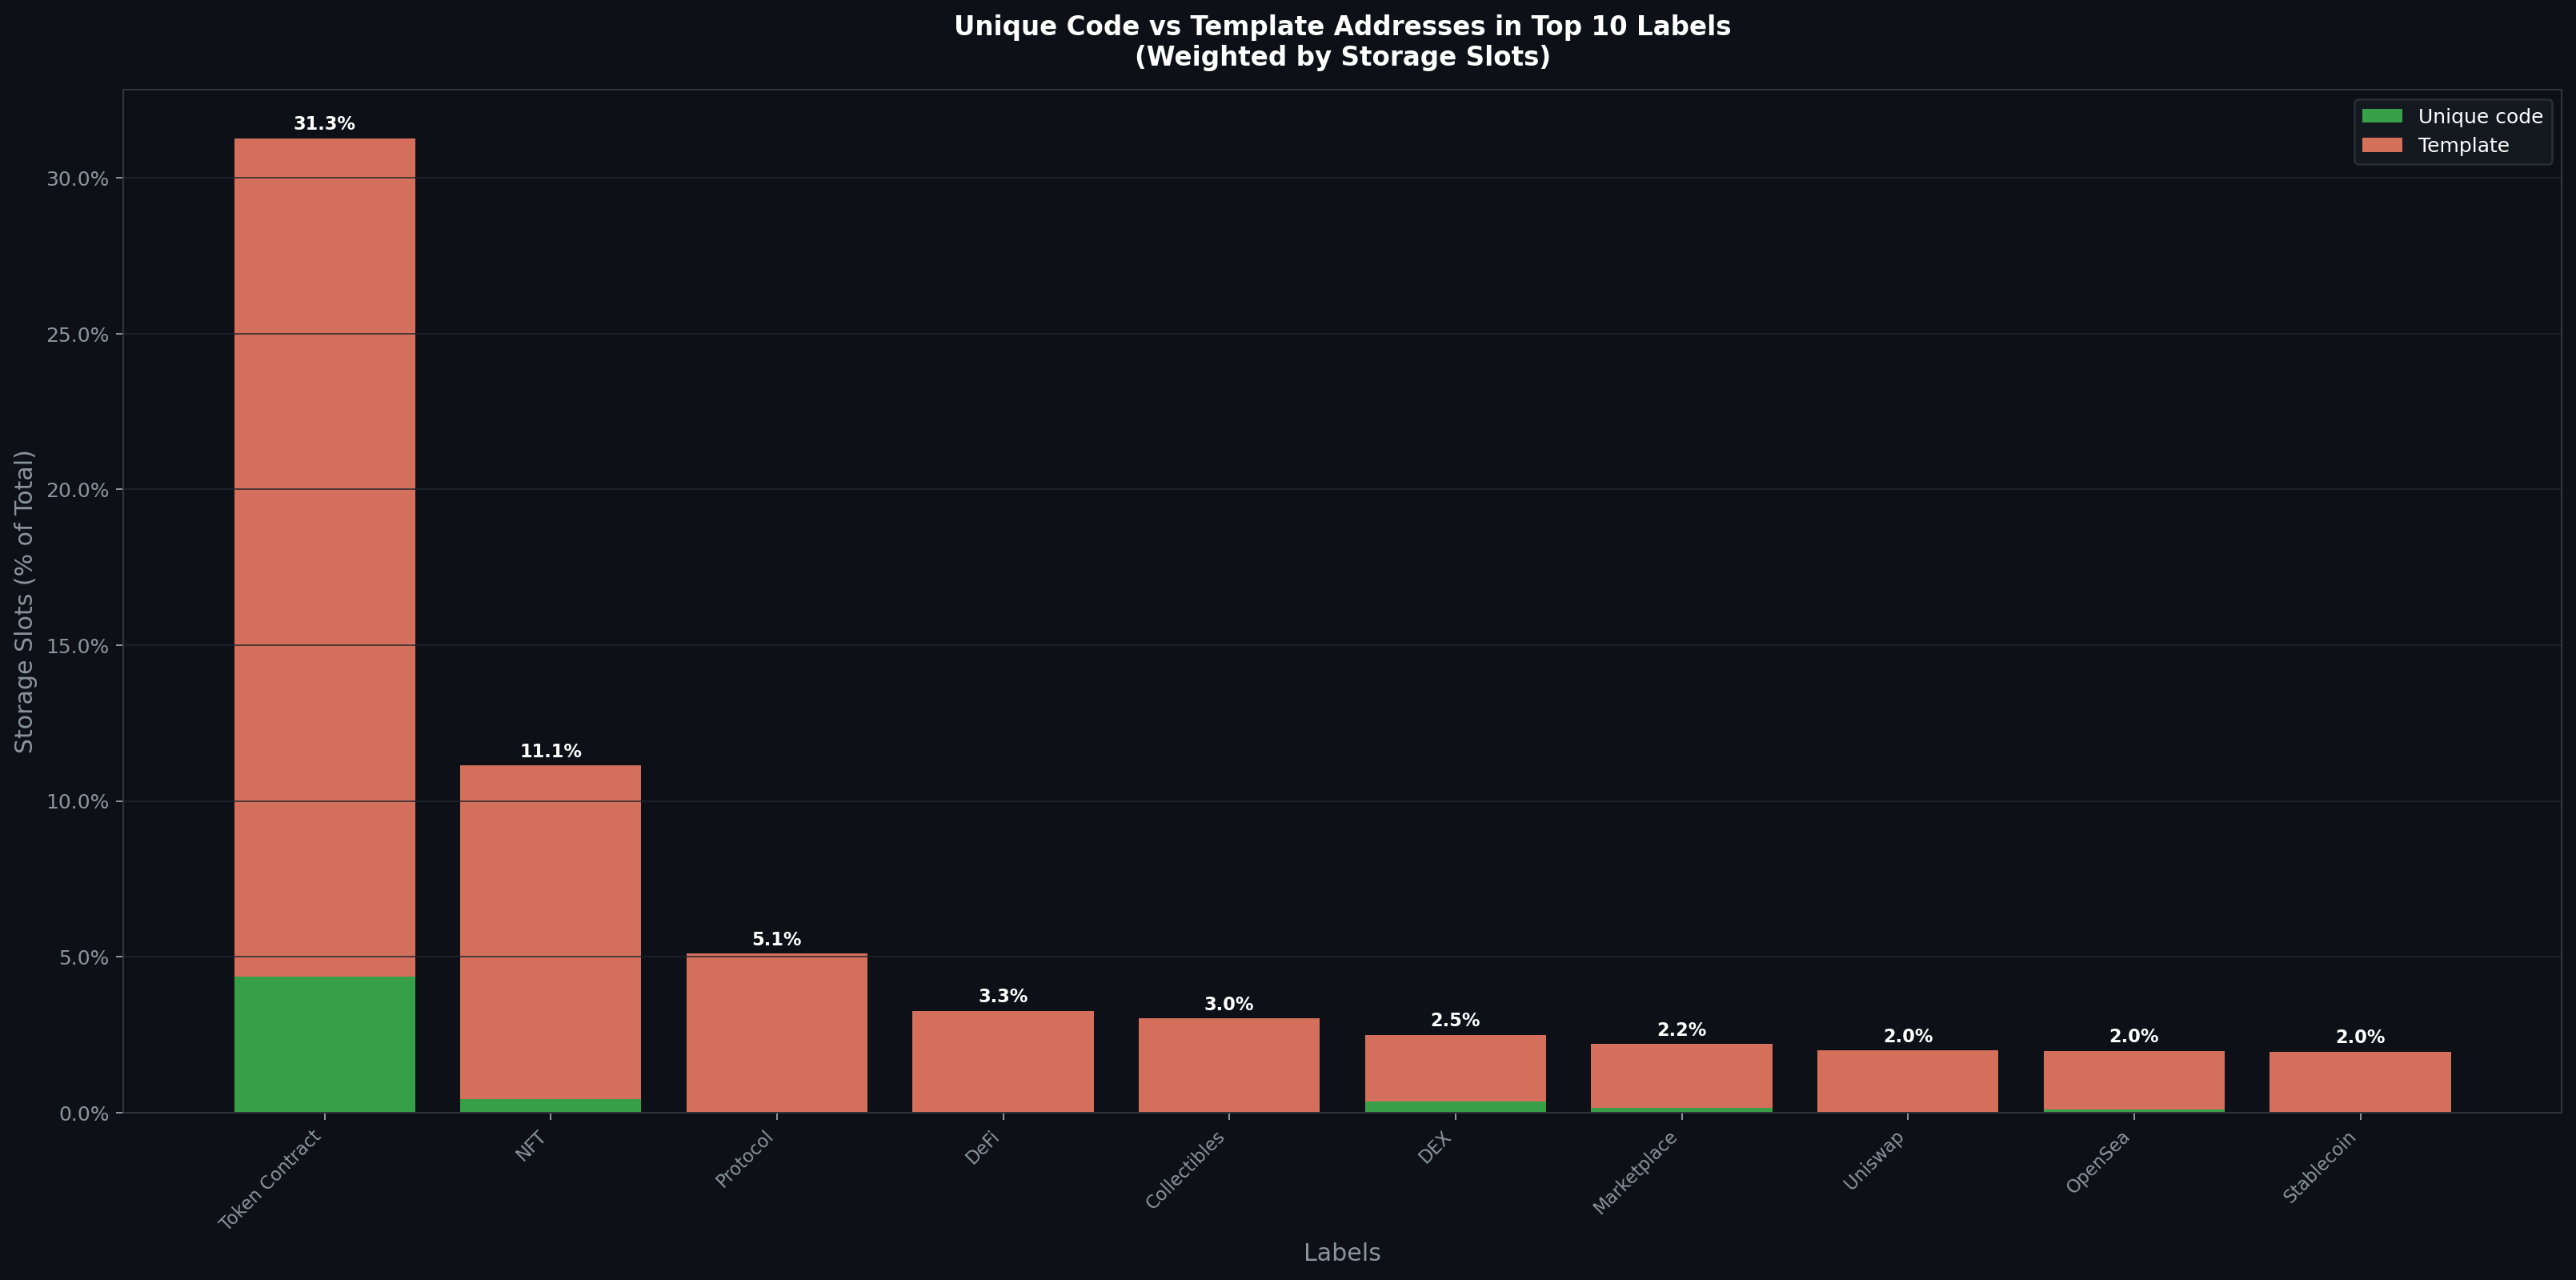
The plot above considers the type of code of the contract. We say a contract is “unique code” if no other contract in the dataset shares the same code. Otherwise, the contract is called a “template”.
Key insight: although most contracts are templates (copied code), Token contracts show higher proportion of unique code.
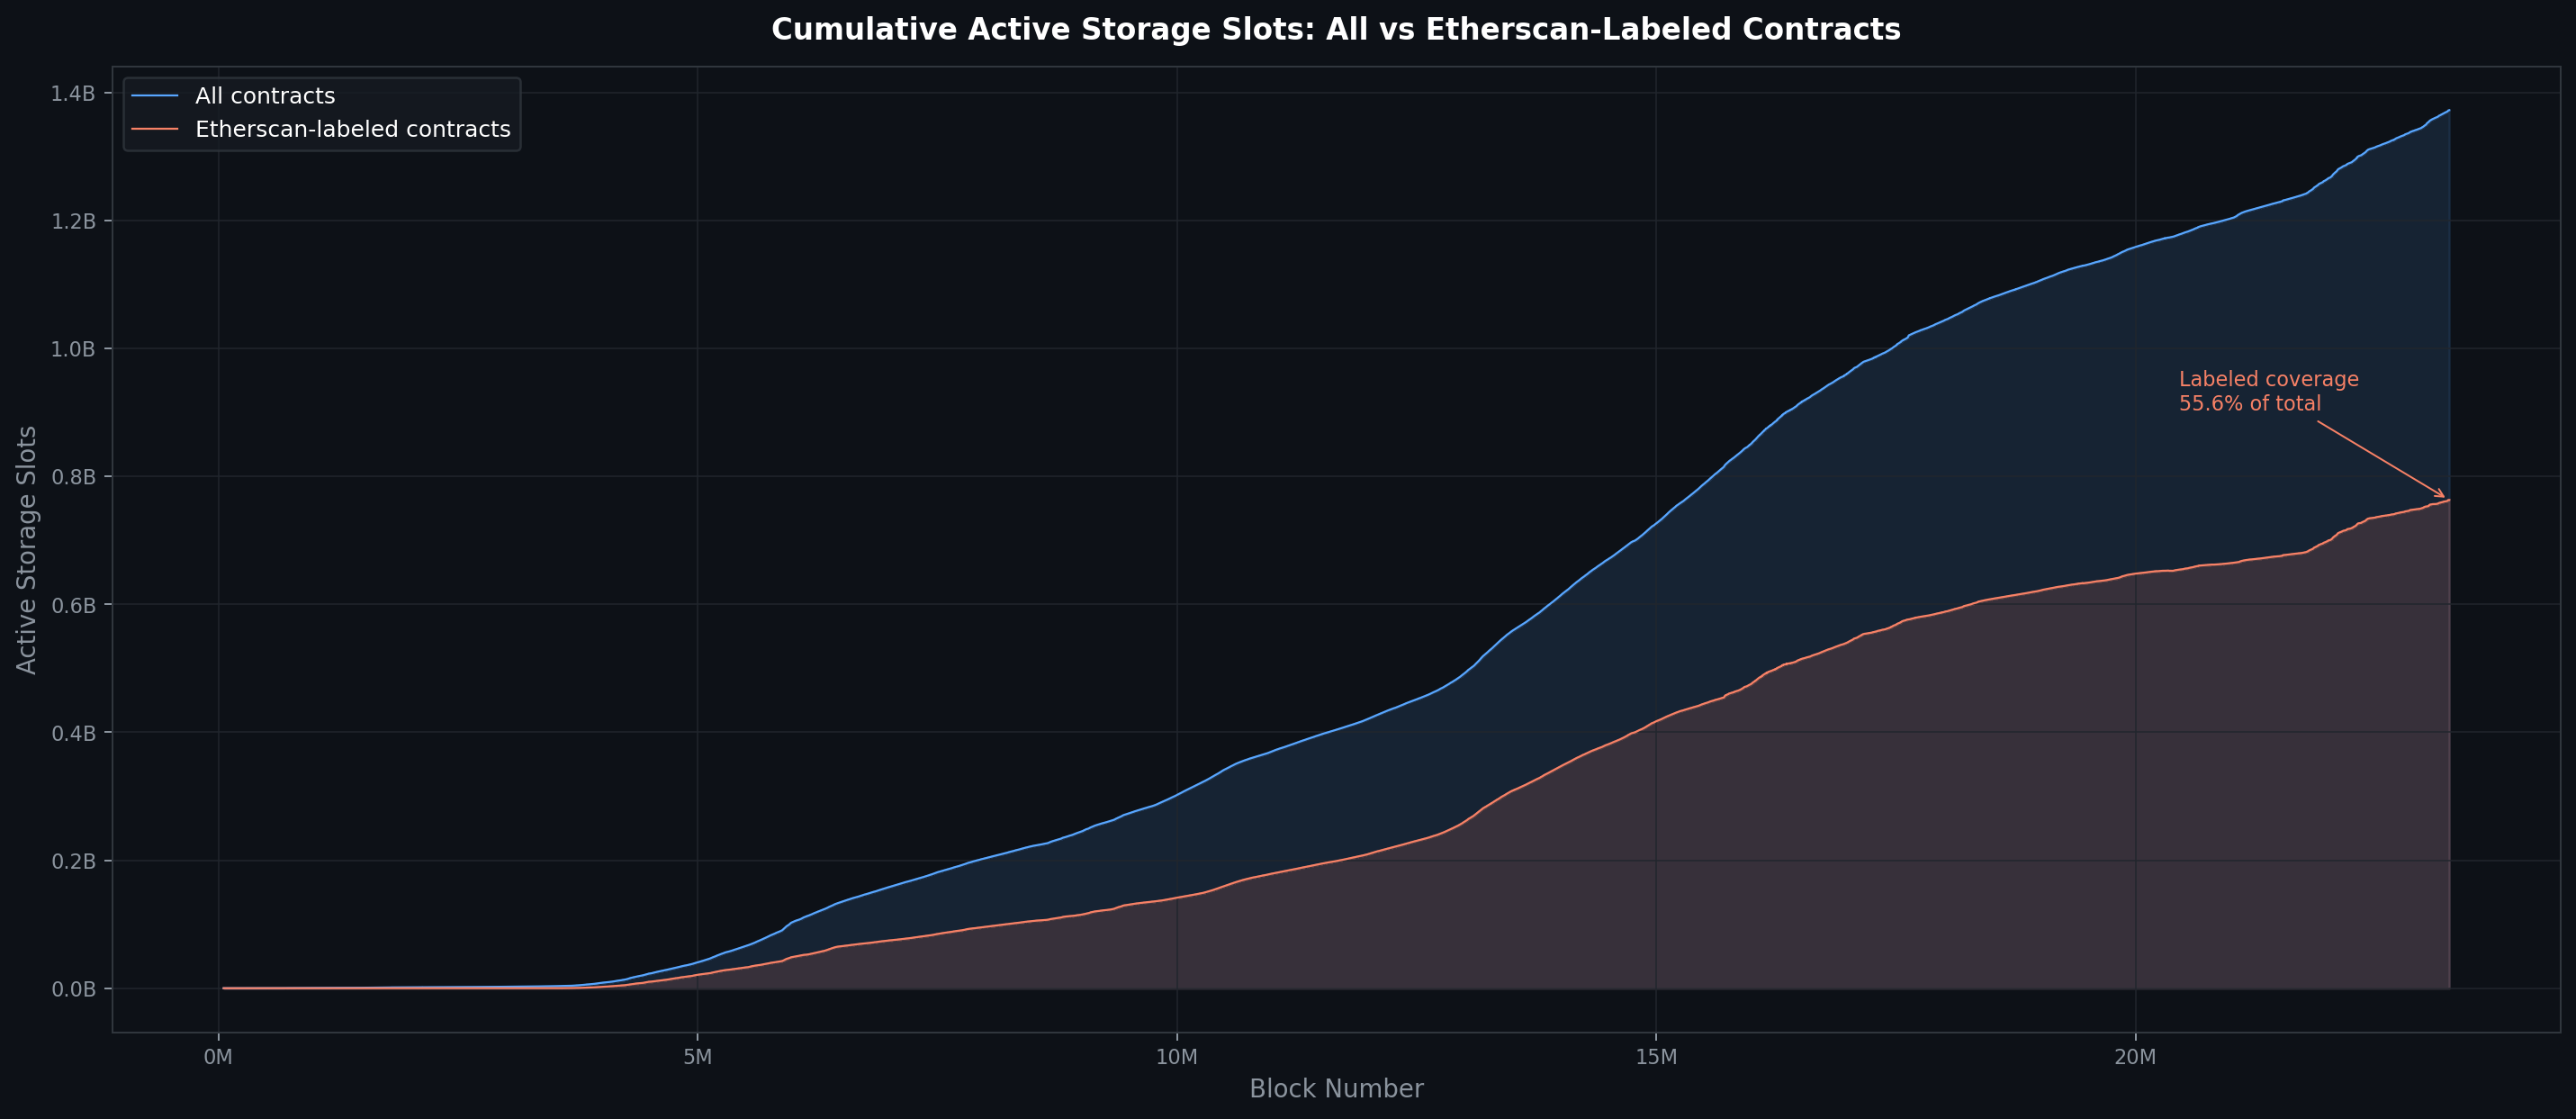
The plot above compares the slot count of the contracts in our labeled dataset vs the slot count of all Ethereum smart contracts.
Key insight: At block 23m, the labeled contracts cover 55% of the total storage slots in Ethereum and the trajectory shows the labeled contracts share is decreasing over time.
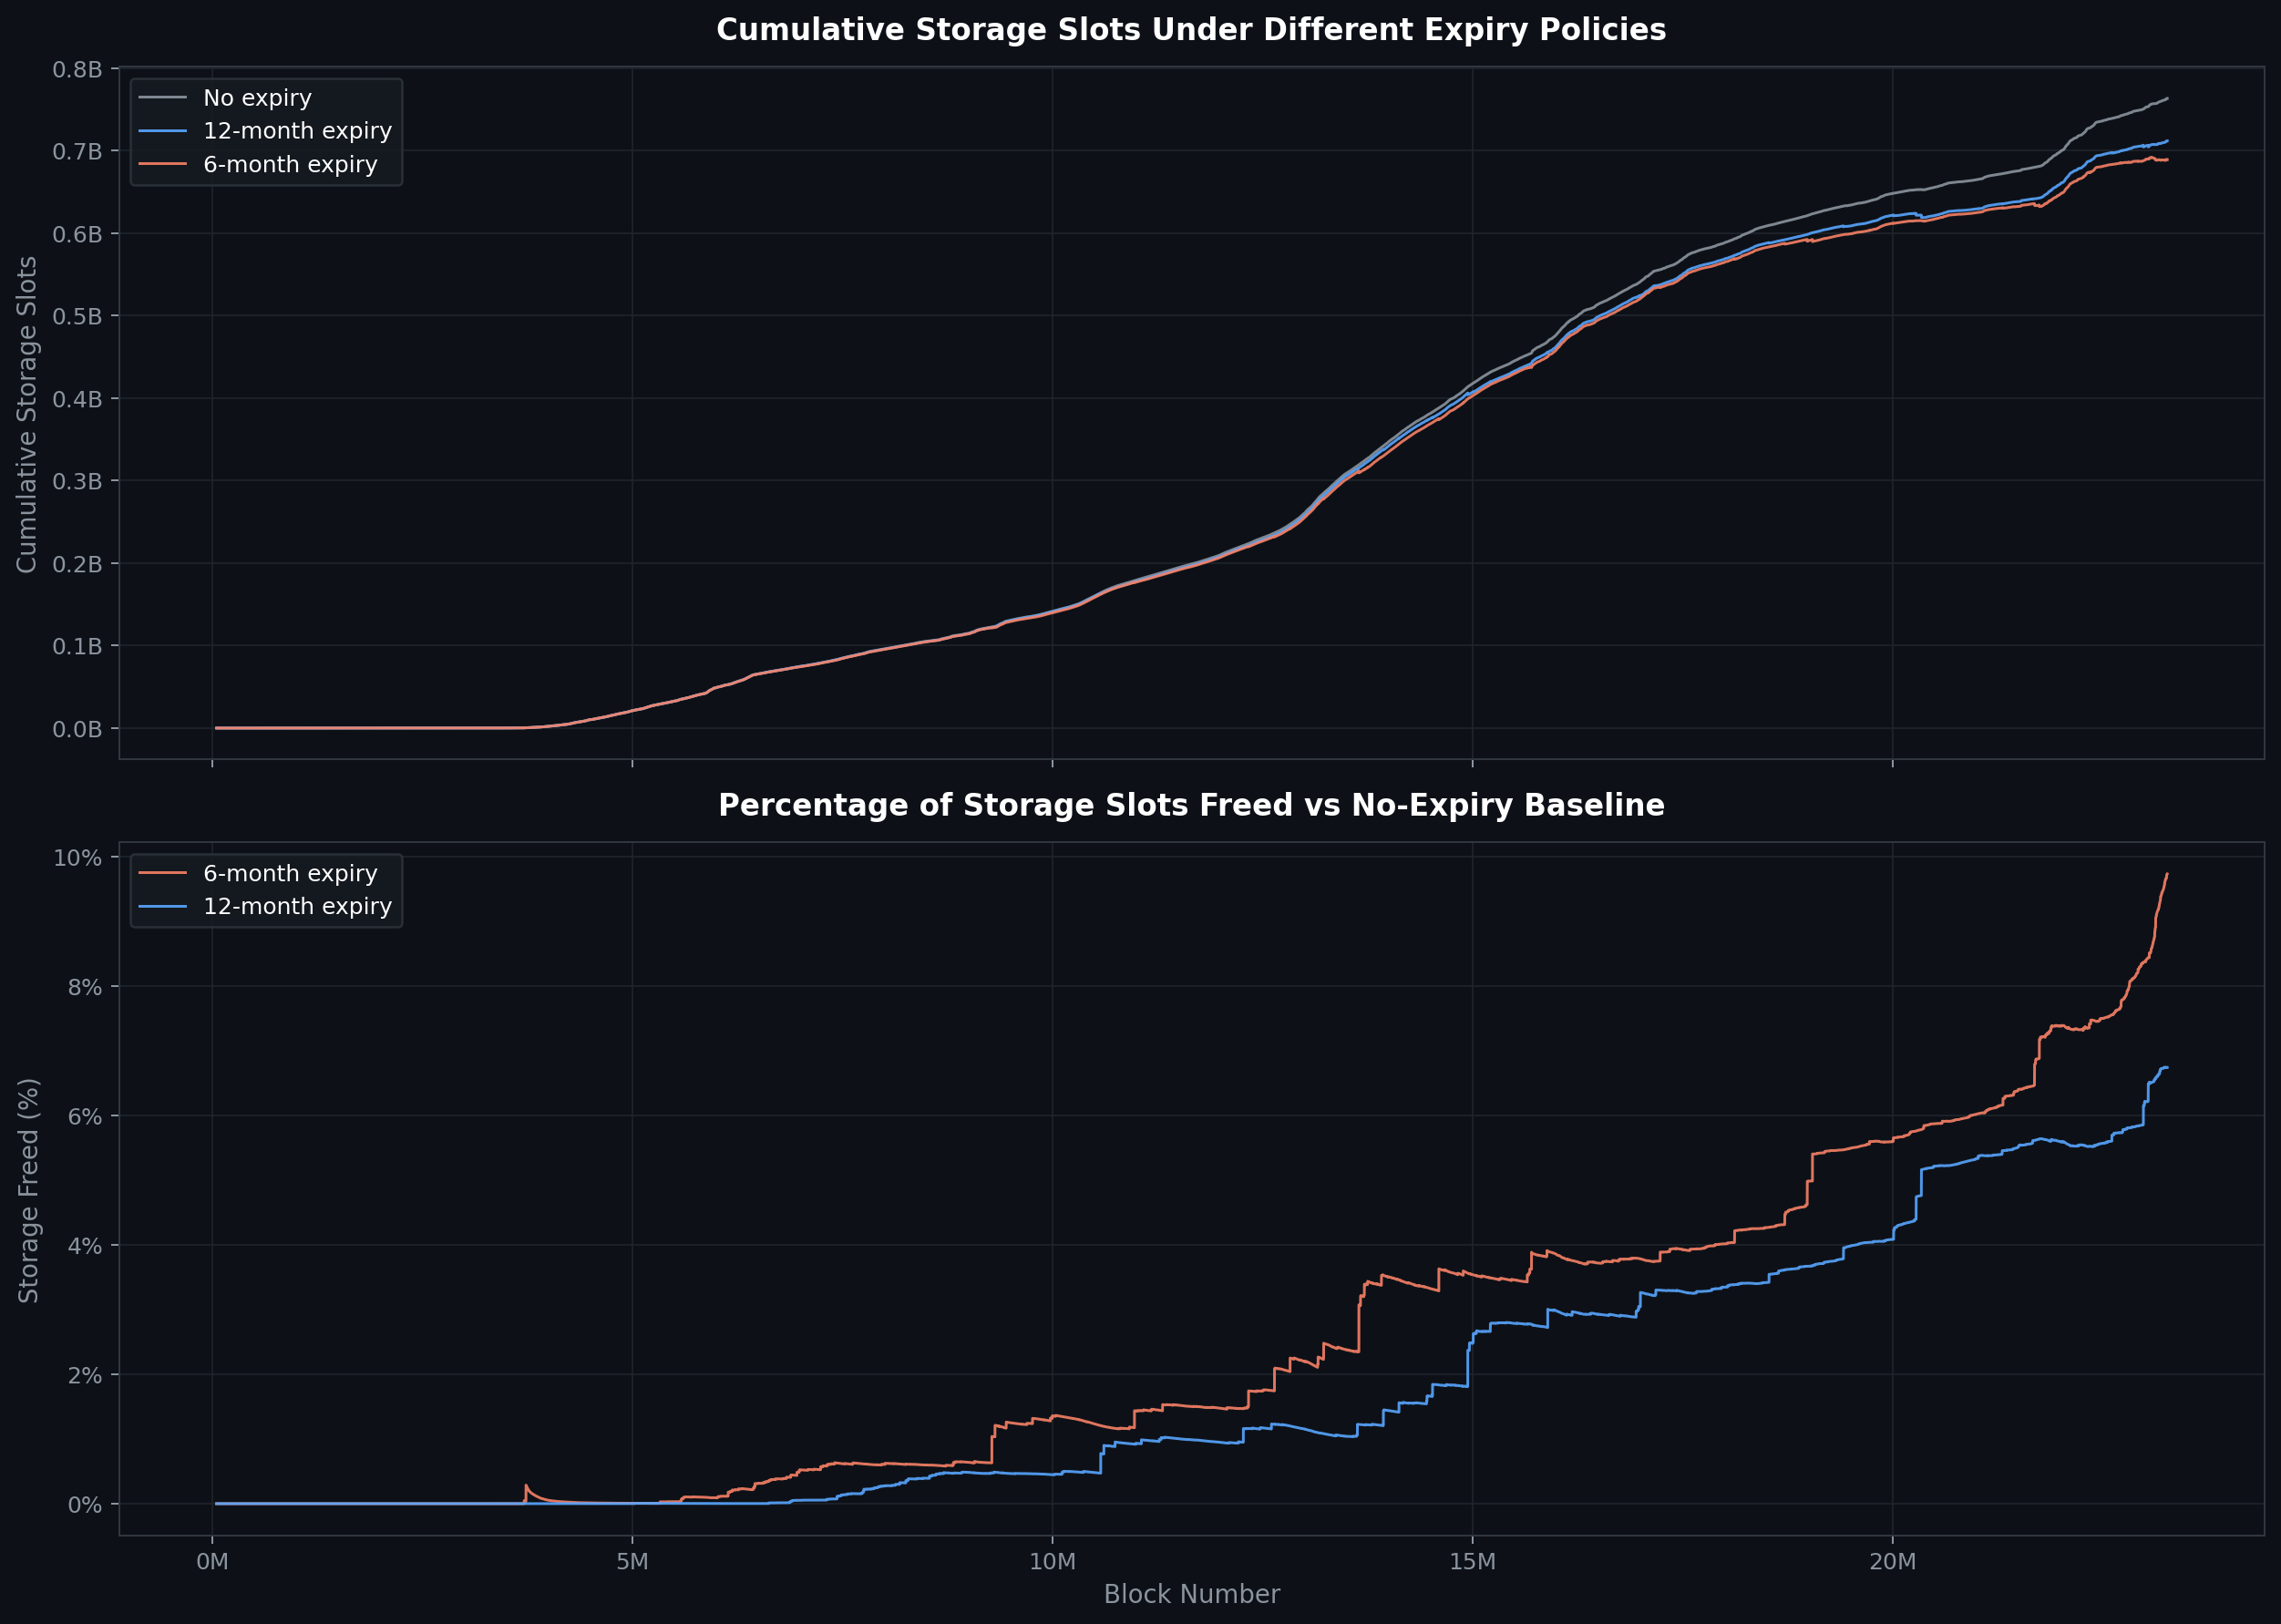
Our last plot (above) compares 6- and 12-months contract level expiry policies for our labeled contracts.
Key insights:
(1) Percentage-wise, (contract-level) expiry policy becomes more effective over time
(2) A previous anlysis of Han showed that contract-level expiry policy of 12 month is expected to free-up about 20% of the total storage slot count. Here we see that 12-months policy frees-up only about 7% of the total (labeled) storage slot count. This suggests that most freed-up slots in expiry policy for all (not necessarily labeled) contracts, come from unlabeled contracts, that are presumably of less interest.